.png)
Understanding the AI Occupancy by Site Report
The Occupancy by Site report shows how often each site was occupied during a date range.
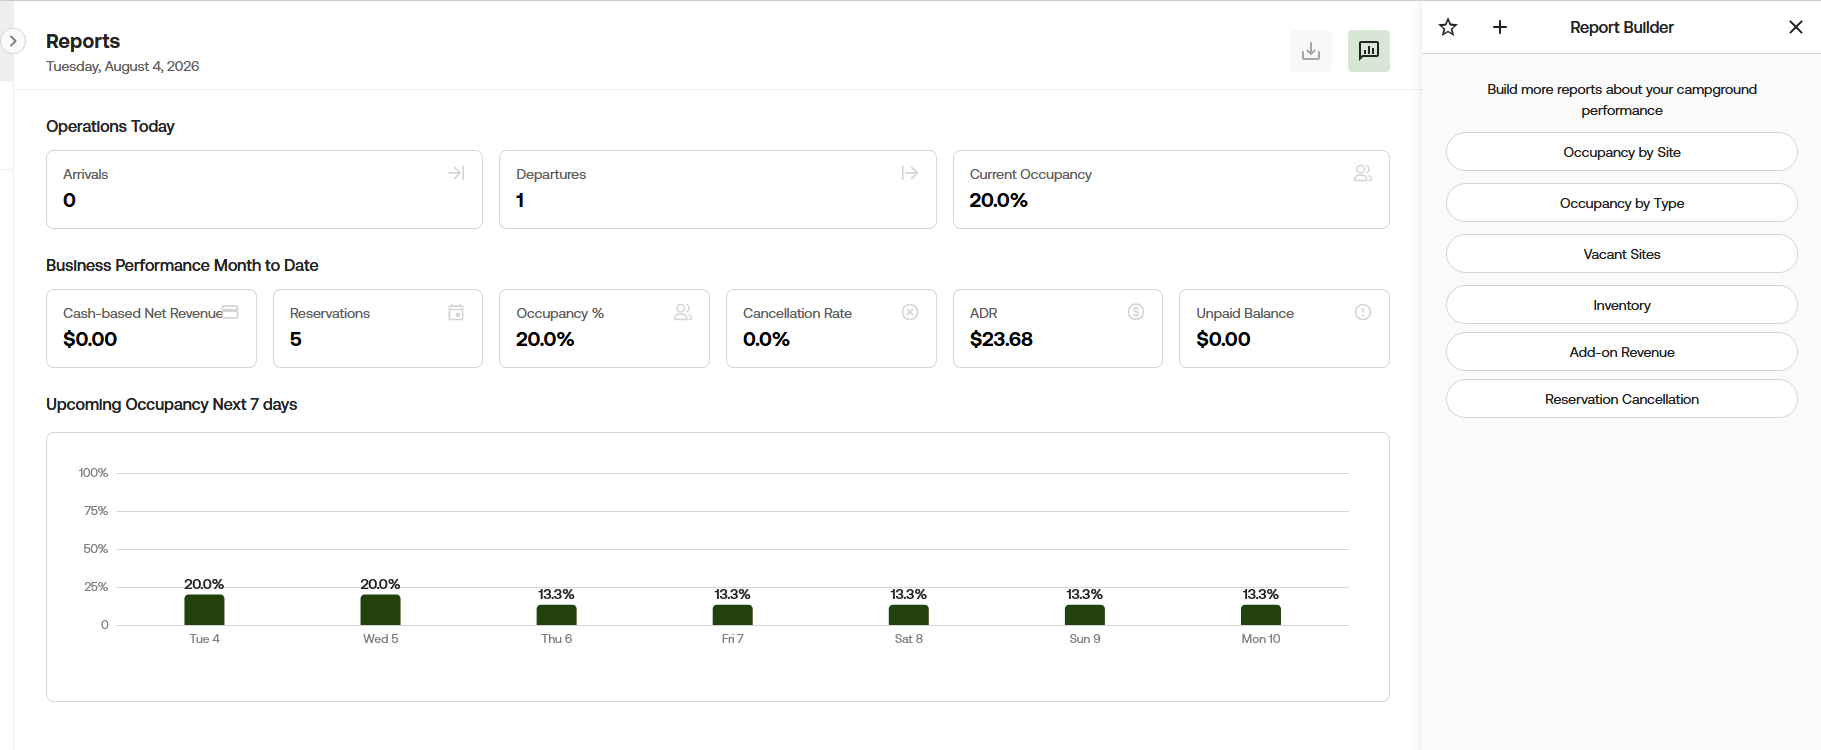
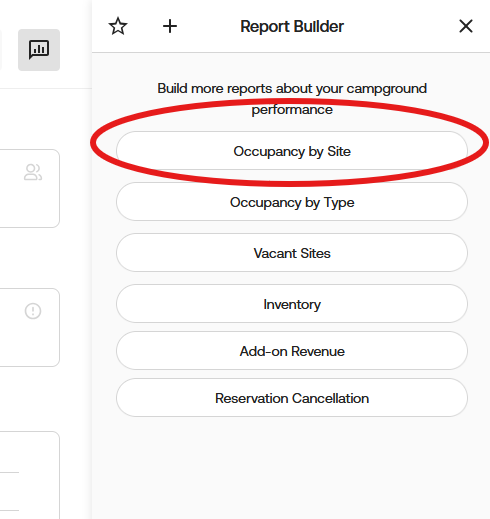
This report is helpful when you want to compare your sites. You can see which sites are being booked, which ones are sitting empty, and how occupancy compares with last year.
Next, choose the period you want to review and choose how you want the report grouped.
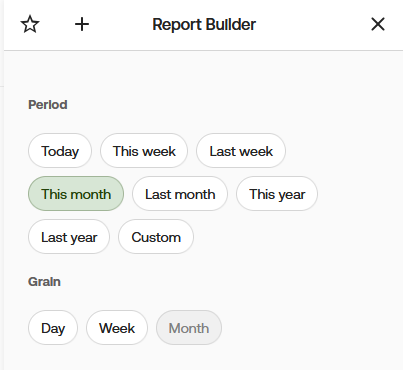
Once you select the period and grain, it will automatically create the report for you.
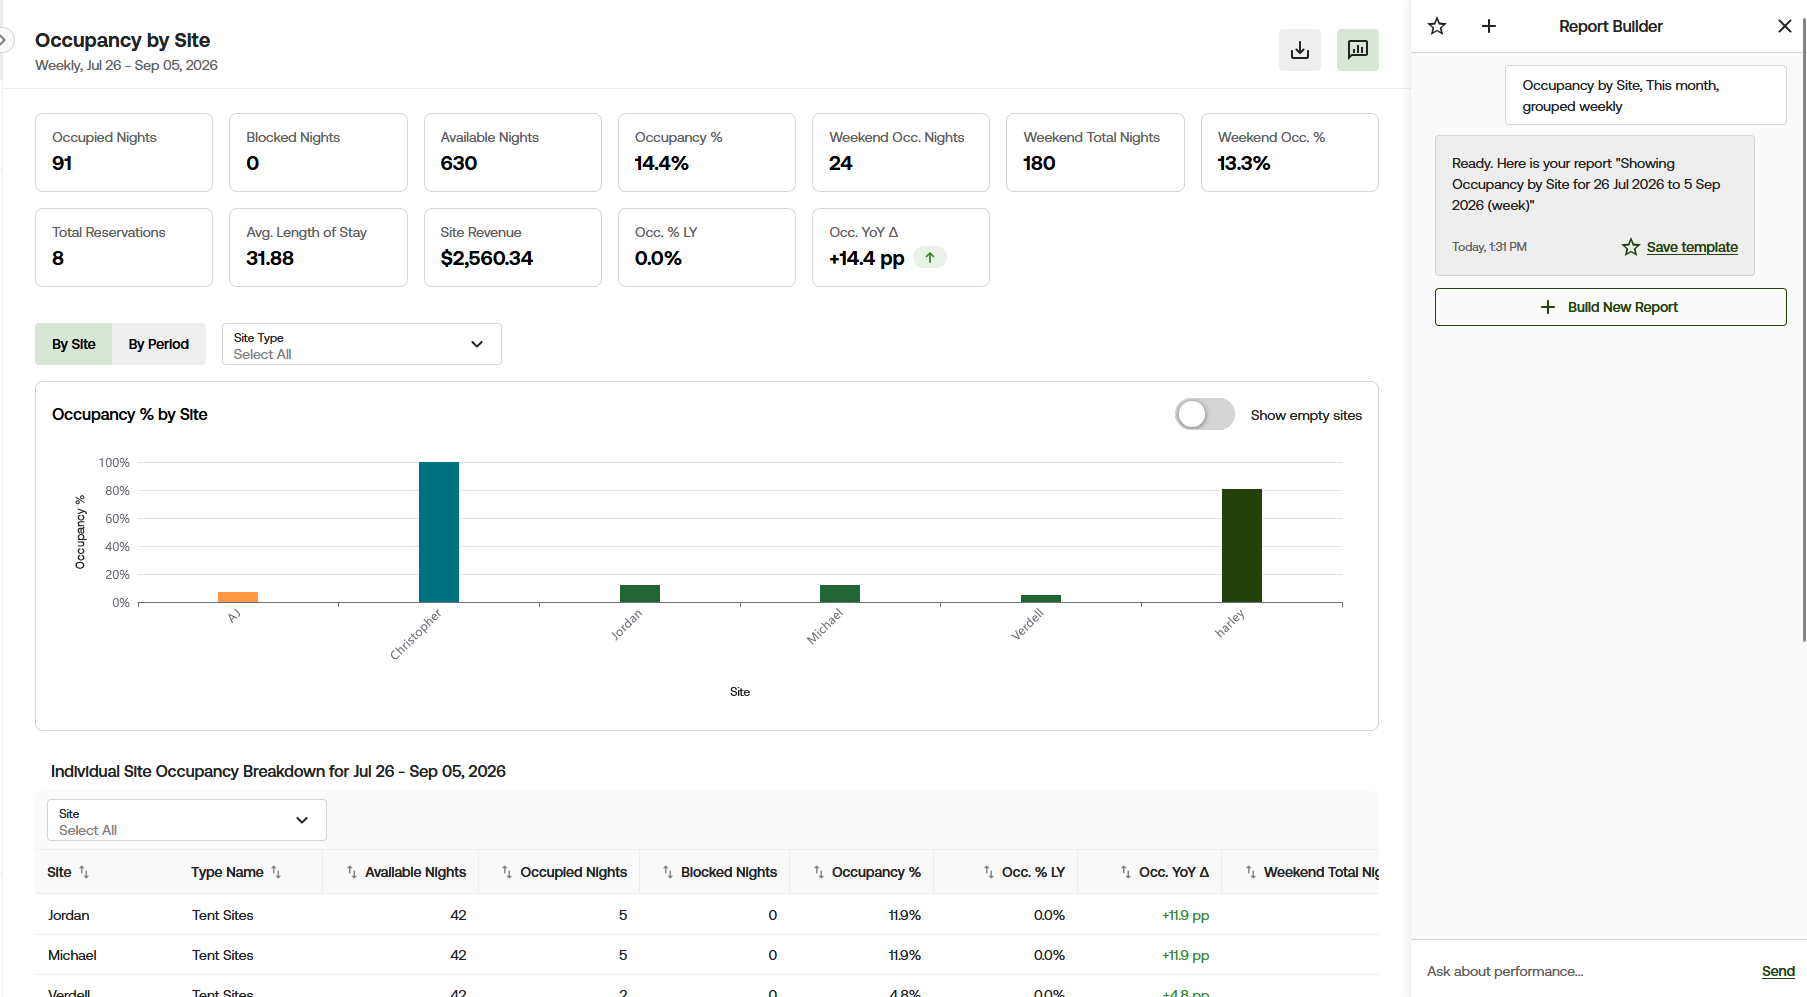
The top-left corner shows the report name, Occupancy by Site. Below the name, you can check how the report is grouped and which dates are included.
In this example, the report is grouped by week and includes July 26 through September 5, 2026.
Report Totals - Understanding what you are seeing.
The cards across the top show the totals for the full report. You can hover over each box to understand what it means.
- Occupied Nights: The total number of nights that sites were occupied. This report shows 91 occupied nights.
- Blocked Nights: The total number of nights that sites were blocked from booking. This report does not have any blocked nights.
- Available Nights: The total number of nights that were available to book. This report shows 630 available nights.
- Occupancy %: The percent of available nights that were occupied. The occupancy for this report is 14.4%.
- Weekend Occ. Nights: The number of weekend nights that were occupied. This report shows 24.
- Weekend Total Nights: The total number of weekend nights included in the report. This report shows 180.
- Weekend Occ. %: The percent of weekend nights that were occupied. The weekend occupancy is 13.3%.
- Total Reservations: The number of reservations included in the report. This report includes eight reservations.
- Avg. Length of Stay: The average length of the stays included in the report. In this example, the average is 31.88.
- Site Revenue: The site revenue included in the report. This report shows $2,560.34.
- Occ. % LY: The occupancy percentage for last year. This report shows 0.0%.
- Occ. YoY Δ: The change in occupancy compared with last year. This report shows an increase of 14.4 percentage points.
The letters pp mean percentage points. The green arrow also shows that occupancy increased compared with last year.
View the Chart by Site or Period
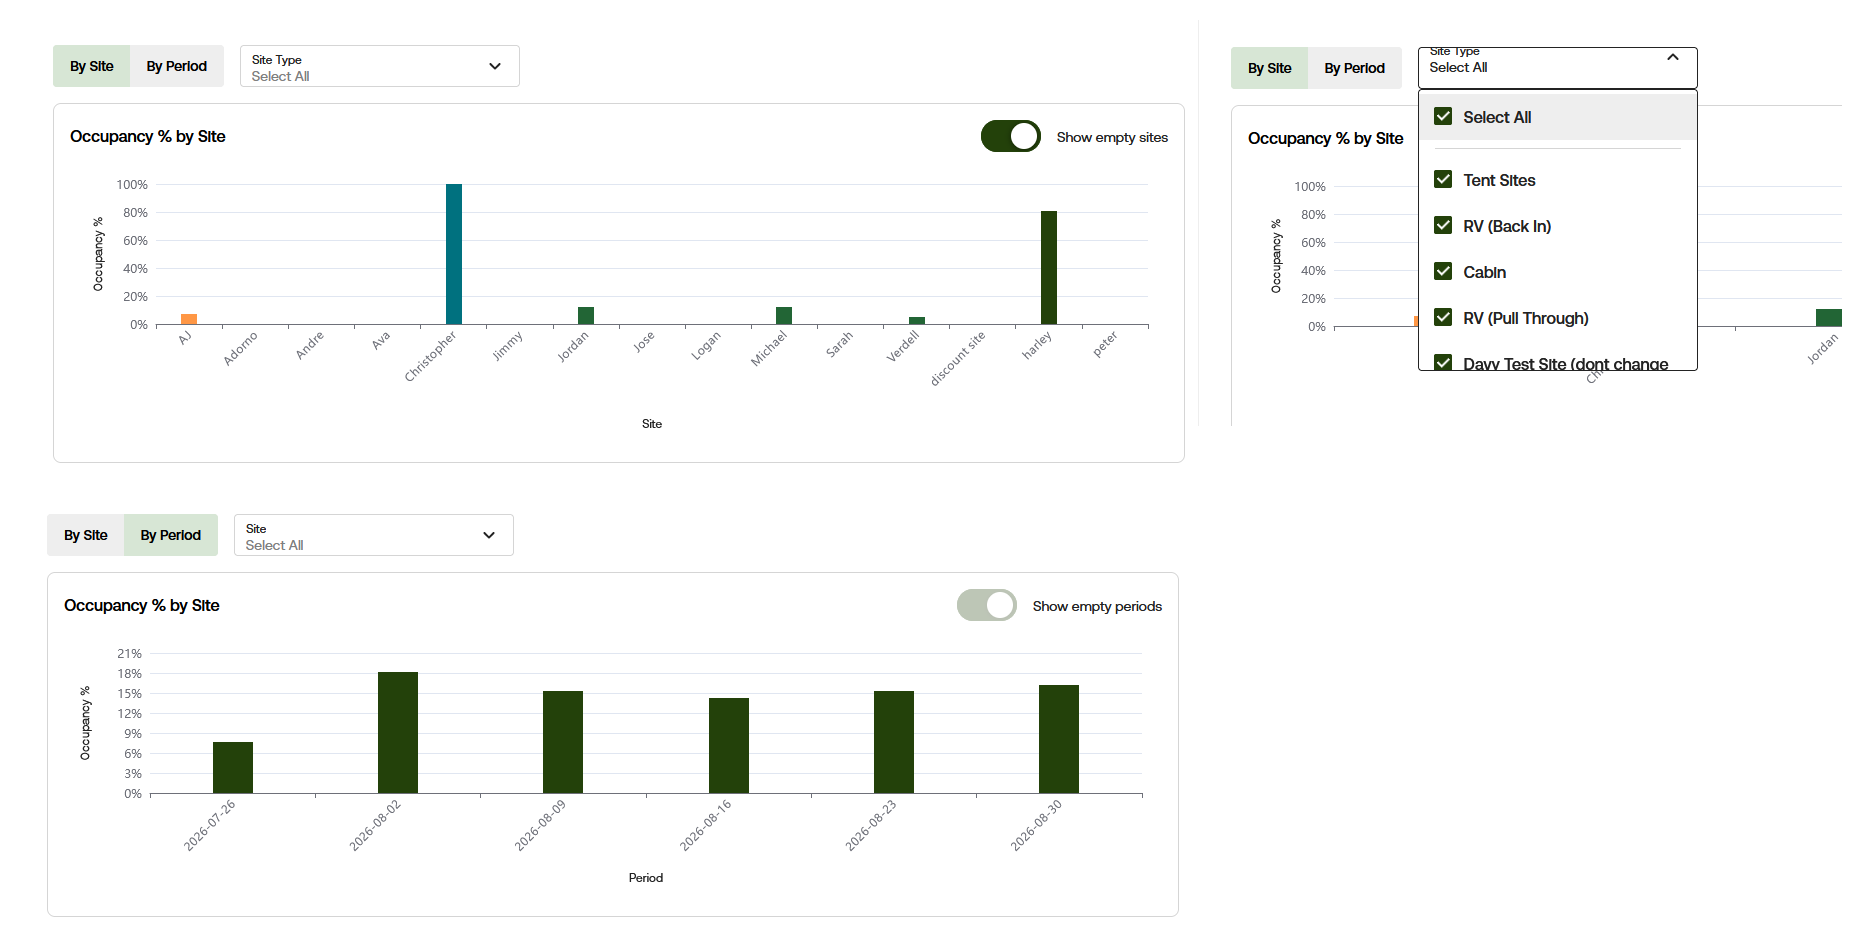
The report gives you two ways to review the chart and it gives you the option to filter what site types you would like to focus on.
Filter by Period
Select By Period to see how occupancy changed during the selected date range.
Instead of showing one bar for each site, the chart shows one bar for each period. The periods are based on the day, week, or month grouping you chose when you created the report.
Filter by Site
The chart compares the occupancy percentage for each site. The site names run along the bottom of the chart. The percentages run along the left side. A taller bar means the site had a higher occupancy percentage during the selected dates.
Download Report
Use the download button in the upper-right corner of the report to download the results.
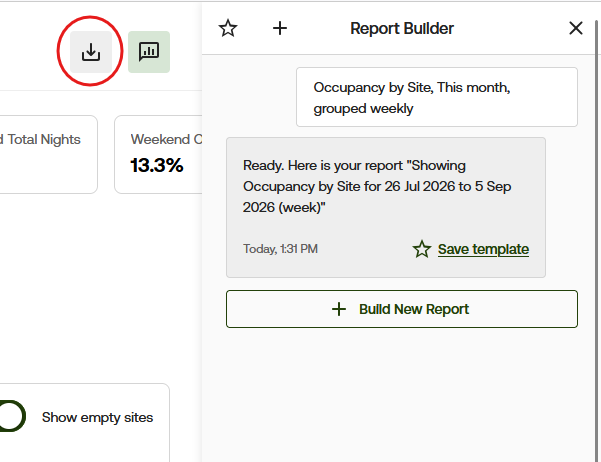
You can also save this report template by clicking on the star.
Need More Help?
If you have questions about AI Reporting or would like help understanding your report results, please contact [email protected].