.png)
Understanding the AI Occupancy by Type Report
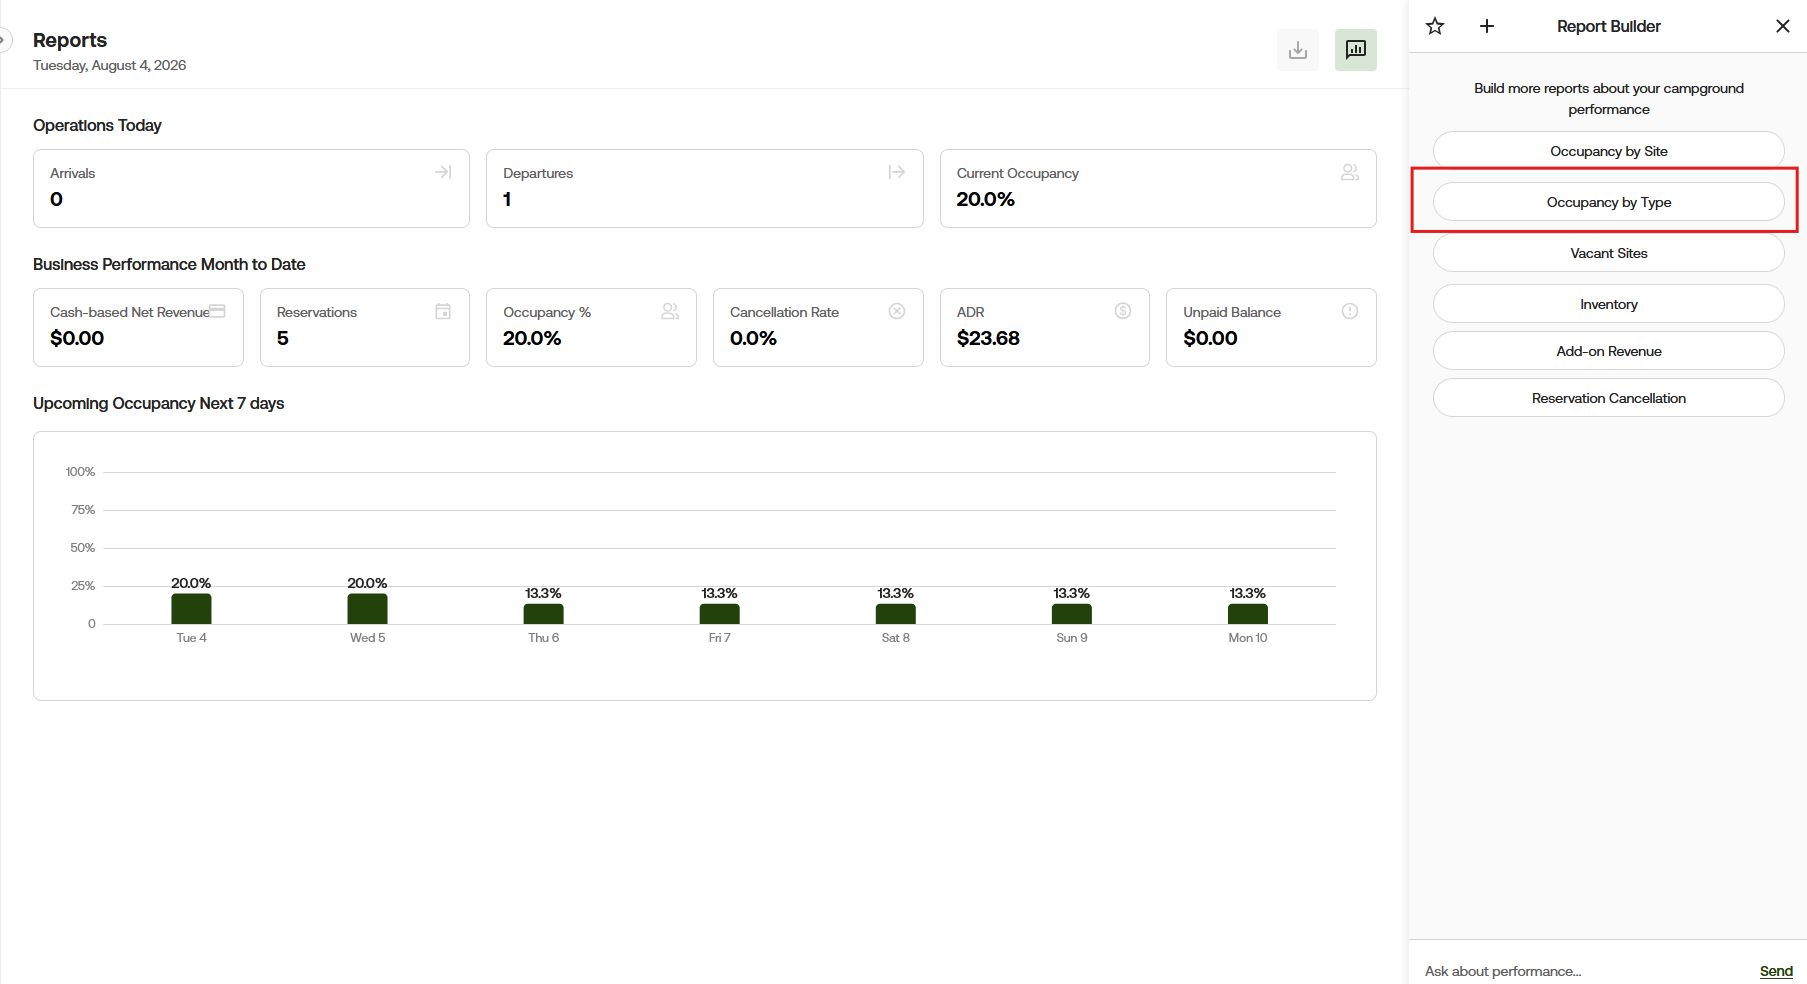
The Occupancy by Type report groups your campground’s occupancy information by site type. Instead of showing each individual site, it combines similar sites into groups such as Cabins, RV Back-In sites, RV Pull-Through sites, and Tent Sites.
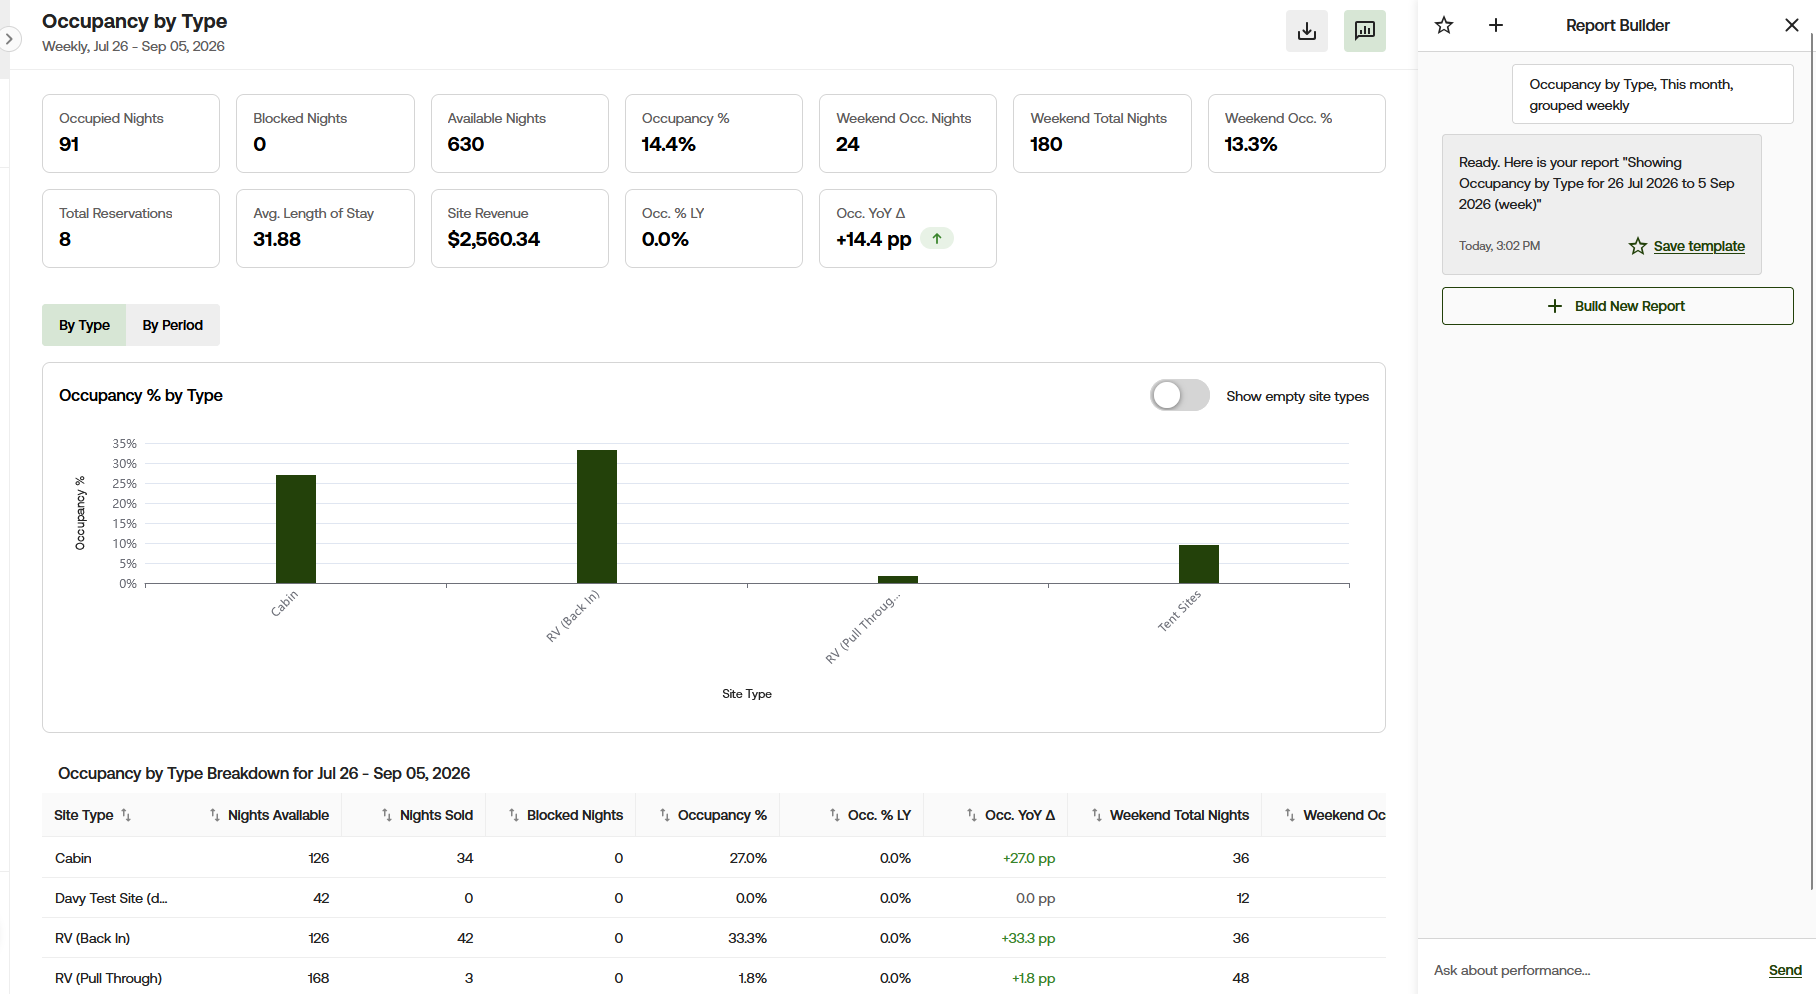
The dates and grouping used for the report are shown under the report name. In this example, the report covers July 26 through September 5, 2026, with the information grouped by week.
Report totals
The boxes at the top give you a summary of occupancy across all site types included in the report.
- Occupied Nights shows the total number of site nights that were occupied during the selected dates. In this example, there were 91 occupied nights.
- Blocked Nights shows the number of site nights that were unavailable because the site was blocked. In this example, there were 0 blocked nights.
- Available Nights shows the total number of site nights that could have been occupied during the selected dates. In this example, there were 630 available nights.
- Occupancy % shows the percentage of available nights that were occupied. In this example, 91 of the 630 available nights were occupied, giving the campground an occupancy rate of 14.4%.
- Weekend Occ. Nights shows the number of occupied site nights that fell on a weekend. In this example, there were 24 weekend occupied nights.
- Weekend Total Nights shows the total number of site nights available during the weekends included in the report. In this example, there were 180 weekend nights.
- Weekend Occ. % shows the percentage of weekend nights that were occupied. In this example, 24 of the 180 weekend nights were occupied, giving the campground a weekend occupancy rate of 13.3%.
- Total Reservations shows the number of reservations included in the report. In this example, there were 8 reservations.
- Avg. Length of Stay shows the average length of the stays included in the report. In this example, the average length of stay is 31.88 nights.
- Site Revenue shows the site revenue included for the selected dates. In this example, the report shows $2,560.34 in site revenue.
- Occ. % LY means Occupancy Percentage Last Year. It shows the occupancy rate for the comparable period last year. In this example, last year’s occupancy was 0.0%.
- Occ. YoY Δ shows how much occupancy changed compared with last year. YoY means year over year, and the triangle symbol is the Greek letter delta, which means change. The change is shown in percentage points, abbreviated as pp. In this example, occupancy increased by 14.4 percentage points compared with last year.
Viewing the report
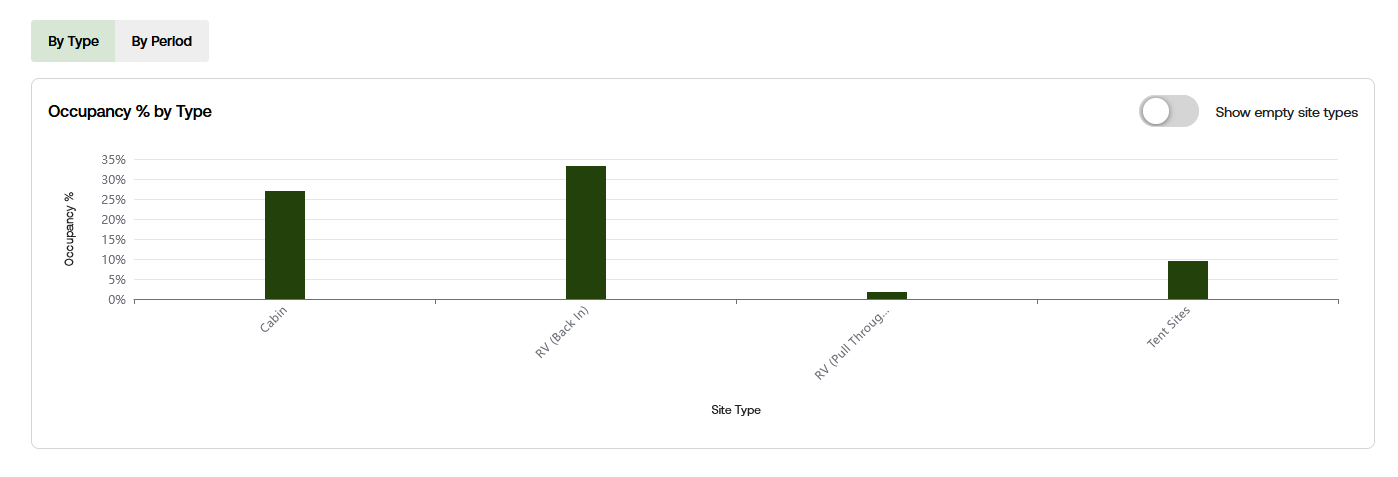
Select By Type to compare the occupancy percentages for each site type.
The chart compares the occupancy percentage of each site type. Each bar represents one site type, and the height of the bar shows its occupancy percentage. This makes it easier to see which types of sites were occupied the most and which had more availability.
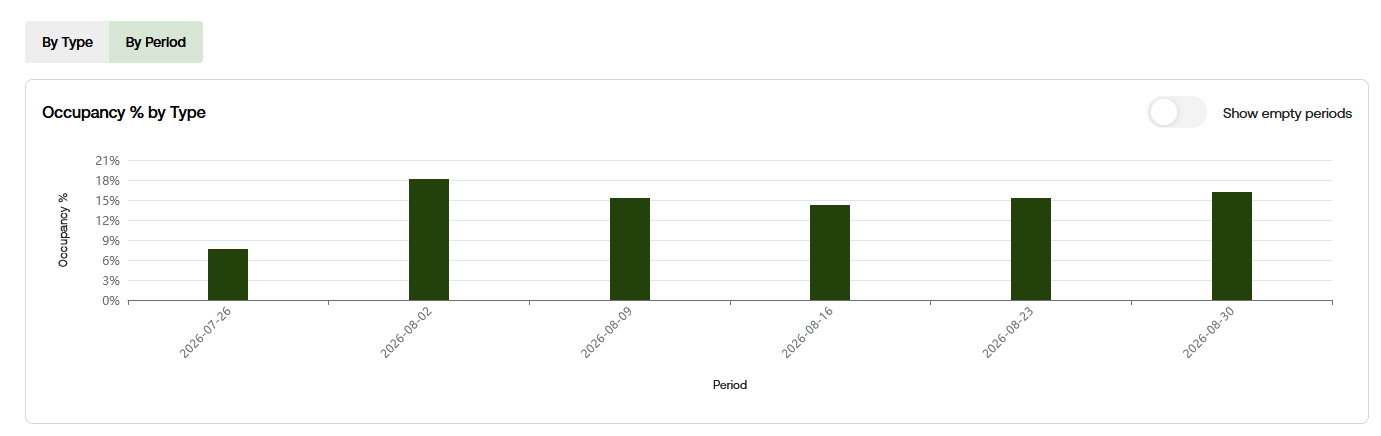
Select By Period to view how occupancy changed throughout the selected time period.
The Show empty site types switch lets you include or hide site types that had no occupancy during
the selected dates.
Viewing Occupancy by Period
Select By Period to see how your campground performed during each week of the selected date range.
The table continues horizontally, so the image above shows both sides of the same table. The arrow indicates that the second section is a continuation of the first.
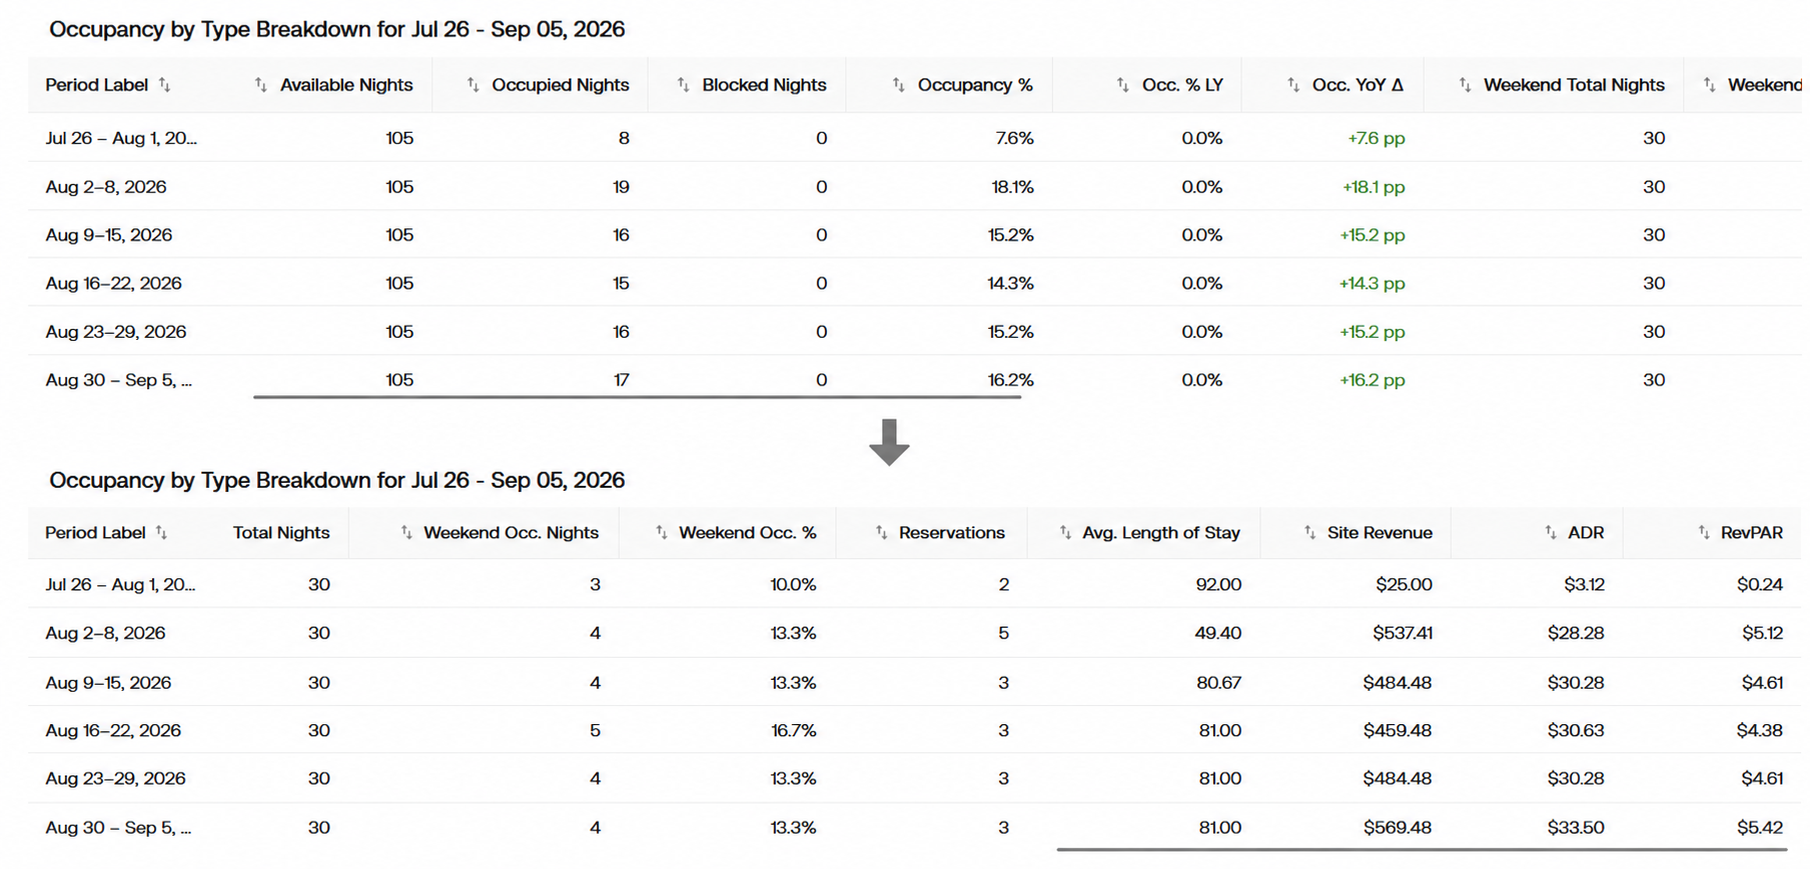
Each row represents one week. This allows you to compare occupancy, reservations, revenue, and average rates from one week to the next.
- Period Label shows the dates included in each week.
- Total Nights shows the total number of weekend nights included for that period.
- Weekend Occ. Nights shows how many of those weekend nights were occupied.
- Weekend Occ. % shows the percentage of weekend nights that were occupied.
- Reservations shows the number of reservations included in that period.
- Avg. Length of Stay shows the average length of the stays included in that period.
- Site Revenue shows the site revenue included for that period.
- ADR stands for Average Daily Rate. This shows the average site revenue earned for each occupied night.
- RevPAR stands for Revenue per Available Site Night. This compares the site revenue with the total number of nights available.
Downloading your report
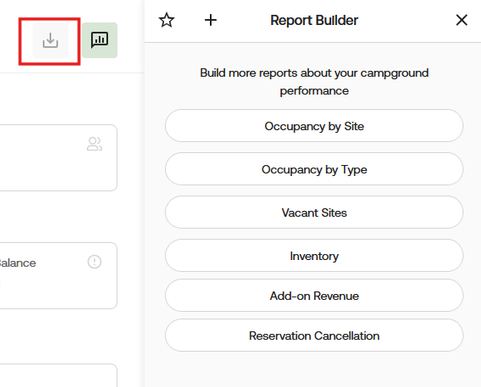
On the top right hand corner, you can download your report. You can also favorite the template by selecting the star icon.
Need More Help?
If you have questions about AI Reporting or would like help understanding your report results, please contact [email protected].