.png)
Understanding How to Use AI Reports
AI Reporting makes it easy to ask questions about your campground data and quickly get a clear report based on exactly what you’re looking for. Whether you’re trying to understand trends, review performance, or narrow in on a specific area of interest, you can guide the report to match your needs. You can either type your question right in the interface in your own words, or you can choose a report from the Report Builder, whichever option is more convenient for you. And because the results are generated from your campground data, you get the insight you want without having to guess where to start.

When you first open AI Reporting, you’ll see a helpful summary of your campground’s current activity and performance right away. The Report Builder will be open on the right side of the page so you can jump in quickly.
The main Reports page is organized into three easy sections:
- Operations Today
- Business Performance Month to Date
- Upcoming Occupancy Next 7 Days
If you want to go deeper, you can use the Report Builder to create a more detailed report. Feel free to choose one of the suggested reports, or just type your question into the "Ask about performance" box at the bottom right hand side of your screen.
Available Reports
Open the Report Builder to see the reports that are currently available, please click each one and read it:
- Occupancy by Site: Shows occupancy for each individual site.
- Occupancy by Type: Groups occupancy by site type.
- Vacant Sites: Shows which sites were vacant during the selected dates.
- Inventory: Shows your total, active, blocked, and guest portal inventory.
- Add-on Revenue: Shows the revenue earned from reservation add-ons.
- Reservation Cancellation: Shows information about cancelled reservations.
Operations Today
This section gives you a quick, friendly overview of what’s going on at your campground today.

Arrivals shows how many reservations are scheduled to check in today. In this example, you don’t have any arrivals.
Departures shows how many reservations are scheduled to check out today. In this example, there’s just one departure.
Current Occupancy shows what percentage of the campground is currently occupied. In this example, current occupancy is 20.0%.
Business Performance Month to Date
This section shows your campground’s totals from the first day of the current month through today.

- Cash-based Net Revenue: shows the revenue collected during the month after refunds are deducted, so it reflects what was actually brought in rather than the gross amount. In this example, the net revenue is $0.00, meaning that after accounting for any refunds, there is no remaining cash-based revenue reported for the month.
- Reservations: shows the total number of reservations for the month, including all bookings that were created within that time period. In this example, there are 5 reservations, which provides a snapshot of how many customer bookings were made during the month.
- Occupancy %: shows the percentage of available site nights that were occupied, based on how many nights had confirmed bookings compared to the total available site nights. In this example, the campground’s occupancy is 20.0%, indicating that only a portion of the available nights were filled during the month.
- Cancellation Rate: shows the percentage of reservations that were cancelled, calculated by comparing the number of cancelled reservations to the total number of reservations for the same period. In this example, the cancellation rate is 0.0%, meaning that none of the 5 reservations were cancelled during the month.
- ADR: stands for Average Daily Rate. This shows the average site revenue earned for each occupied night, helping you understand the typical revenue generated per booked night rather than per reservation. In this example, the average daily rate is $23.68, which represents the average earnings across the occupied nights during the month.
- Unpaid Balance: This feature is currently out of commission, so it is not available to view or use at this time. More information will be added once it becomes available, and we will update the description when the reporting is fully supported.
Upcoming Occupancy Next 7 Days
This chart shows the percentage of your campground expected to be occupied on each of the next seven days.
By looking at these day-by-day occupancy estimates, you can get a clear picture of how demand is trending over the coming week. This makes it easier to plan ahead, whether you’re trying to schedule staffing, prepare amenities, or anticipate overall visitor levels.
In addition, this chart can help you quickly see which upcoming days are expected to be busier and which days still have more availability. If you notice higher occupancy on certain days, you may want to consider ways to manage the increased traffic, while lower-occupancy days can give you an opportunity to focus on things like maintenance, restocking, or other preparedness tasks.
Overall, the chart is designed to give you a simple, at-a-glance view of expected occupancy so you can make more confident decisions throughout the week.

Each bar represents one day, making it easy to track how demand changes over time. The percentage shown above the bar indicates how much of the campground is expected to be occupied on that specific date, so you can quickly understand the expected level of usage at a glance. In general, a taller bar means a higher percentage of the campground is occupied, which typically implies fewer sites are likely to be available. Conversely, a shorter bar means a lower expected occupancy rate, which indicates that more sites should be open for guests.
In this example, occupancy is expected to be 20.0% on Tuesday and Wednesday, reflecting a slightly higher expected usage during those days. After that, the expected occupancy changes to 13.3% each day from Thursday through Monday. As a result, the campground should have a relatively more available capacity for guests during the Thursday-to-Monday period compared with Tuesday and Wednesday. Overall, this chart helps you anticipate when occupancy is likely to be higher and when more sites may be available.
Download Report
To get started, please use the download button in the upper-right corner of the report. This will let you download the results in a convenient format so you can review them right away or share them with your team if needed. If you do not see the download option immediately, double-check that you are viewing the full report page and that the report has finished loading, and then try the button again.
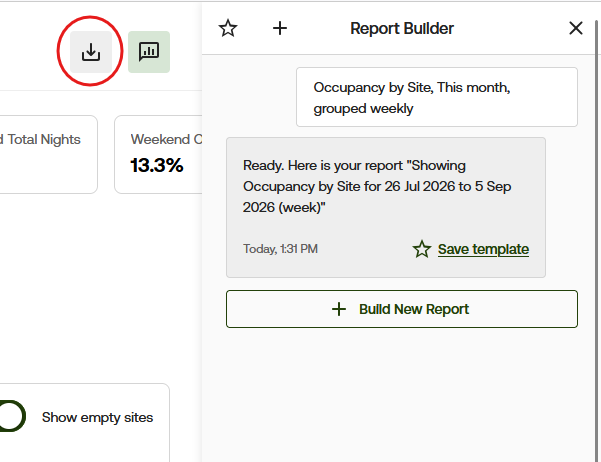
Select Save template in the Report Builder to store your report setup for later use. This option lets you preserve the choices you make while building the report, including the report type, the date range, and any grouping selections. That way, you can return to the Report Builder and run the same type of report again without having to reselect those settings from scratch. In addition, saving a template is meant for reusing your configuration, not for retrieving output
Saving a template does not download the report results.
Need More Help?
If you have questions about AI Reporting or would like help understanding your report results, please contact [email protected].