.png)
Understanding the AI Inventory Site Report
The Inventory report shows how many sites your campground has and how that inventory changed during the selected date range.
To open this report, select Inventory from the Report Builder. You can also type a request into the Ask about performance box, such as “Show me the Inventory report for this month.”
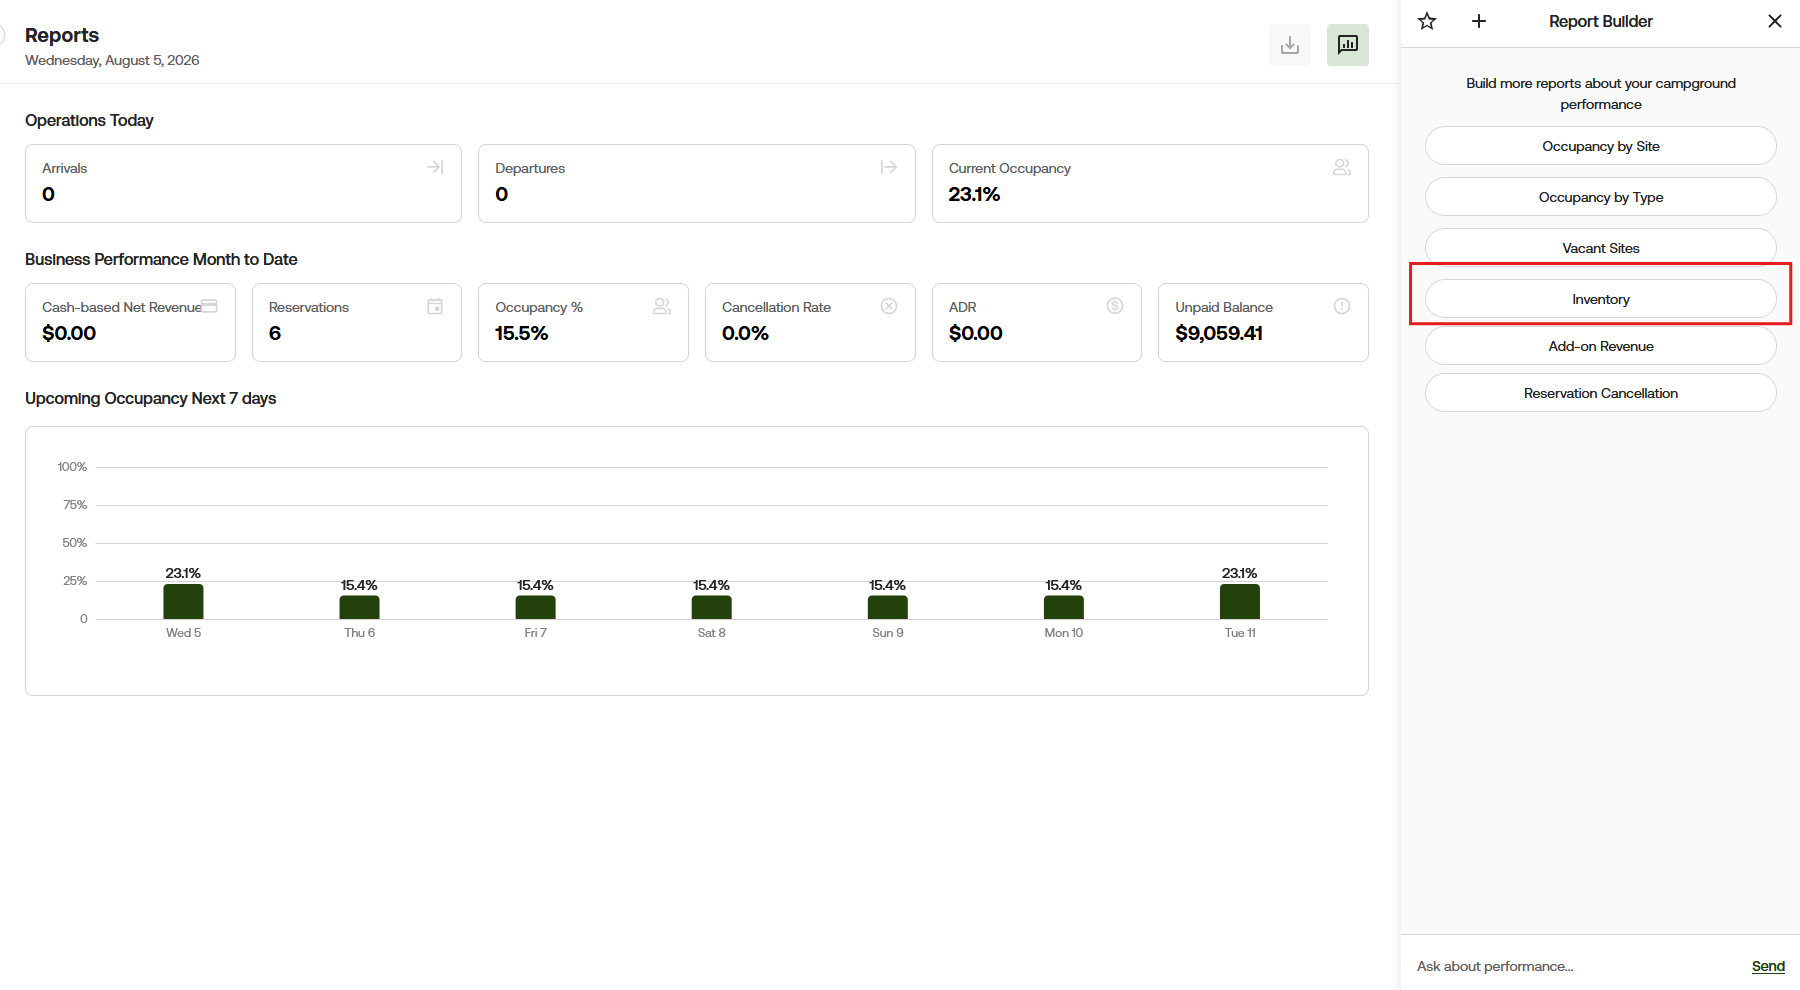
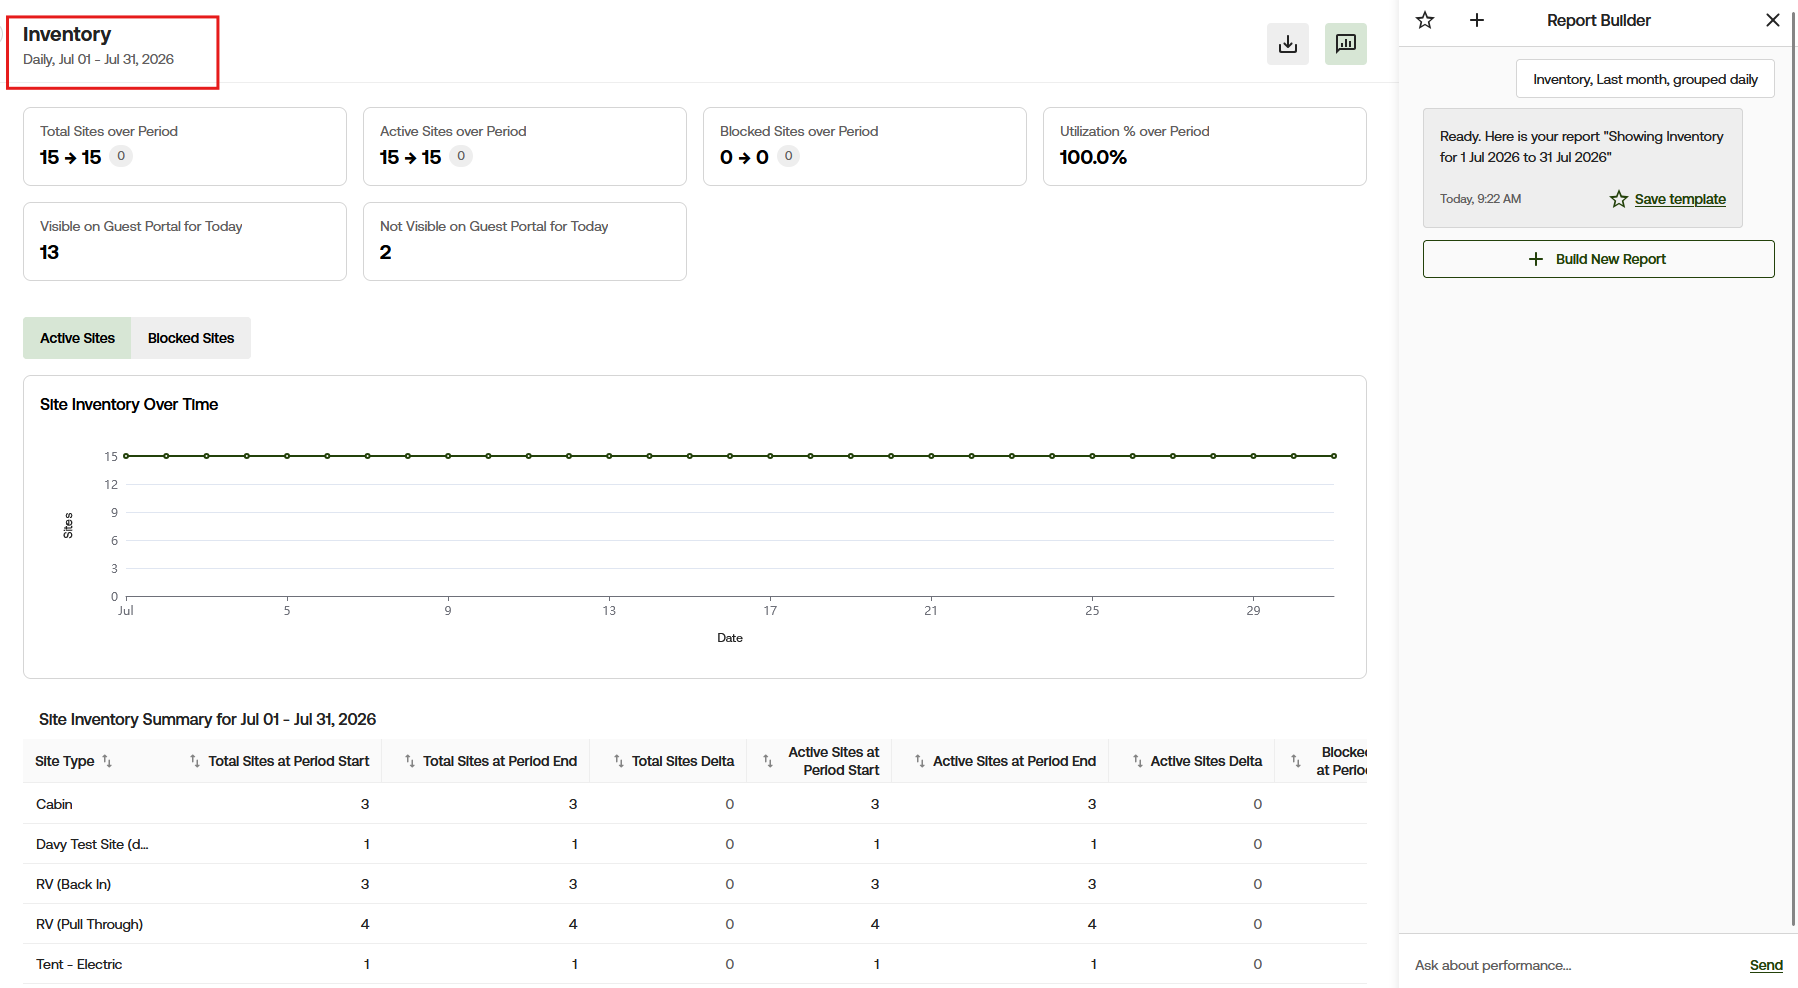
The Inventory report shows the number of sites in your campground and whether that number changed during the selected date range. It also separates your inventory into active and blocked sites.
The dates and grouping used for the report are shown under the report name. In this example, the report covers July 1 through July 31, 2026, with the information grouped daily.
Report totals
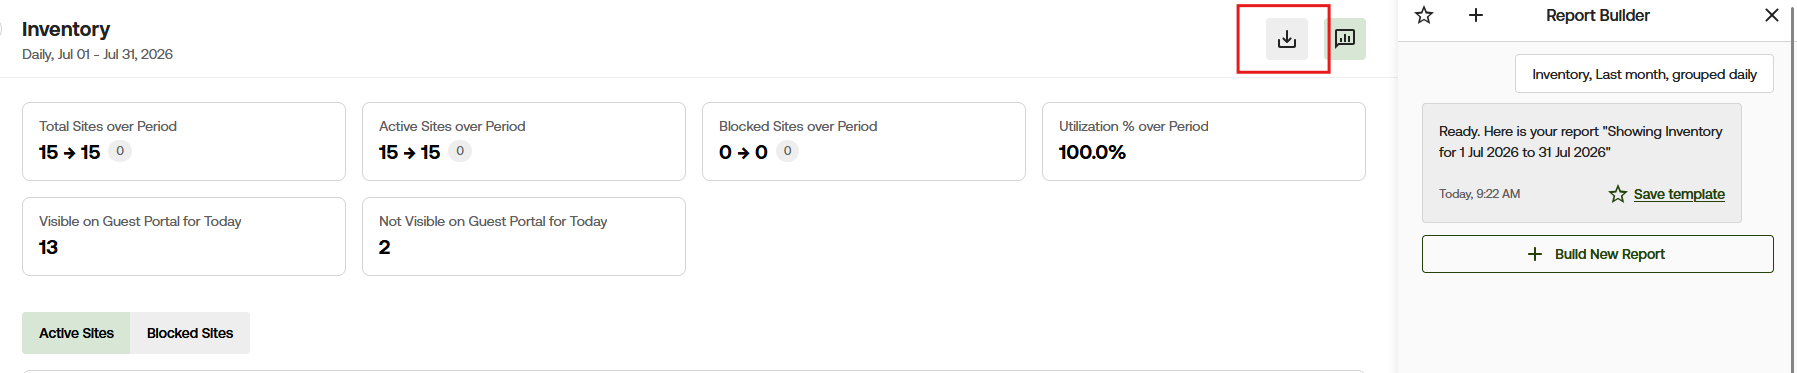
The arrows in the summary boxes show the number at the beginning of the selected period and the number at the end. The smaller number beside the arrow shows the difference between the two totals.
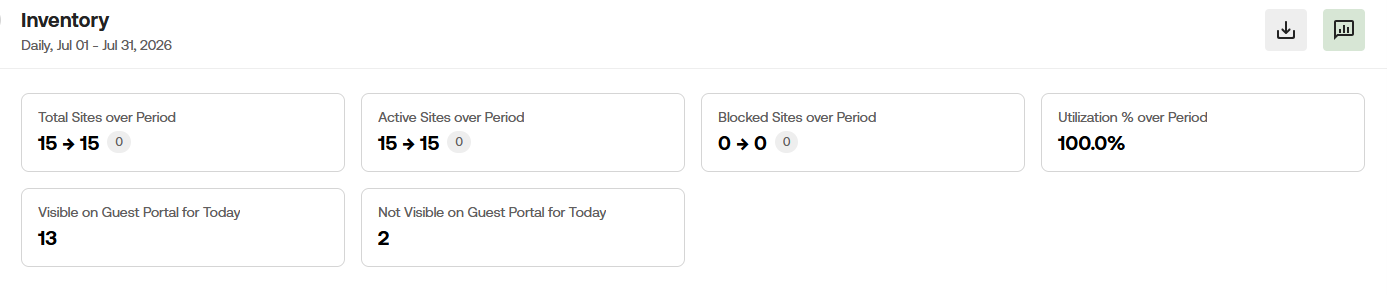
- Total Sites over Period shows your total number of sites at the beginning and end of the selected dates. In this example, the campground started with 15 sites and ended with 15 sites, so there was no change.
- Active Sites over Period shows the number of active sites at the beginning and end of the selected dates. In this example, there were 15 active sites at both the beginning and end of the month.
- Blocked Sites over Period shows the number of blocked sites at the beginning and end of the selected dates. In this example, there were 0 blocked sites at both the beginning and end of the month.
- Utilization % over Period shows the percentage of the campground’s total inventory that was active during the selected dates. In this example, utilization was 100.0% because all 15 sites were active.
Note: Utilization is based on whether sites are active, not whether they were occupied by guests. Use an occupancy report to see how many site nights were booked.
- Visible on Guest Portal for Today shows how many sites are currently visible to guests on the online booking page. In this example, 13 sites are visible.
- Not Visible on Guest Portal for Today shows how many sites are not currently visible on the online booking page. In this example, 2 sites are not visible.
Site Inventory Over Time
The chart shows whether the number of active or blocked sites changed during the selected dates.
Select Active Sites to view the number of active sites for each day. In this example, the campground had 15 active sites throughout the month.
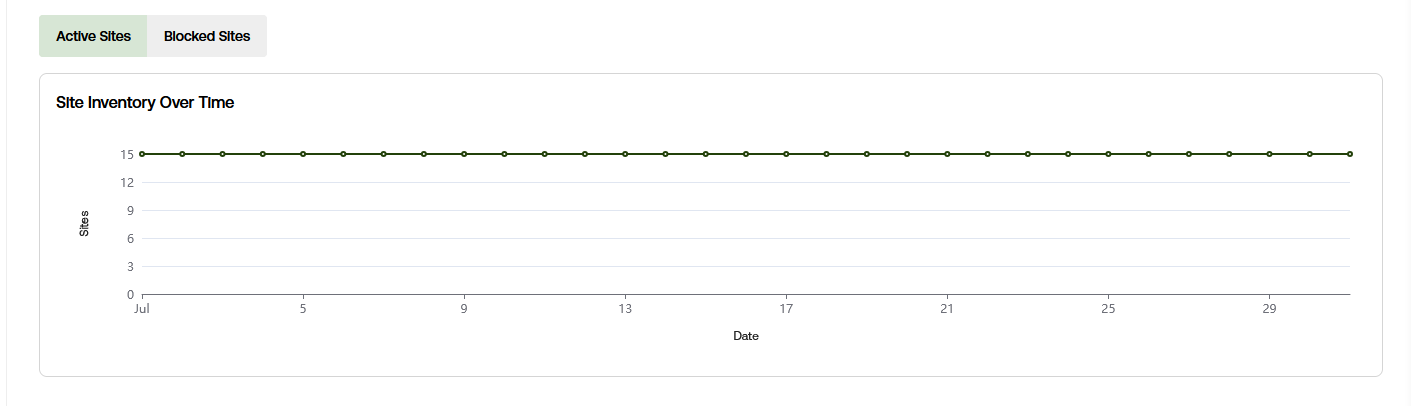
Select Blocked Sites to view the number of blocked sites for each day. In this example, the campground had 0 blocked sites throughout the month.
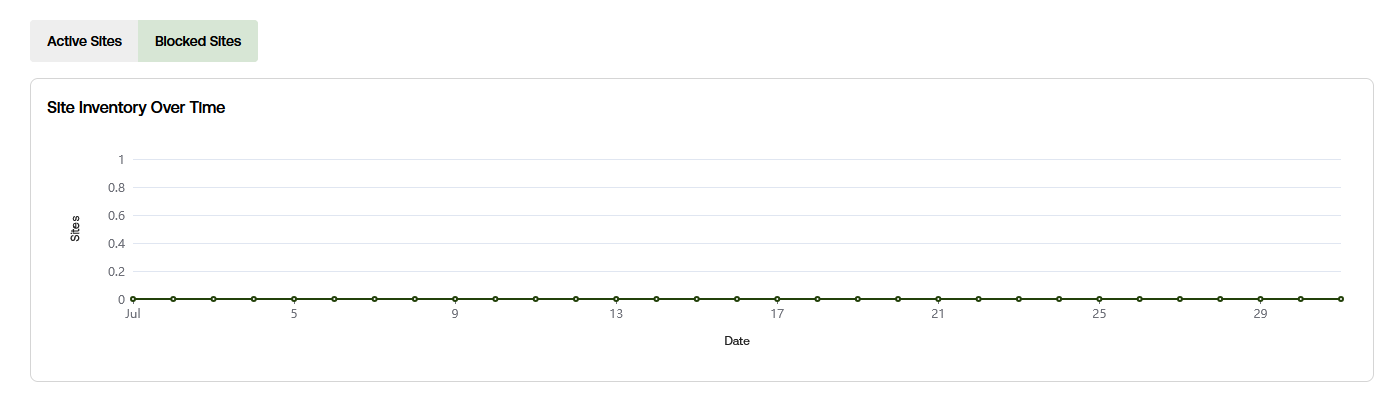
A flat line means the number stayed exactly the same. If any sites were added, removed, activated, or blocked during the selected dates, the line would shift up or down so you can clearly see what changed.
Site Inventory Summary
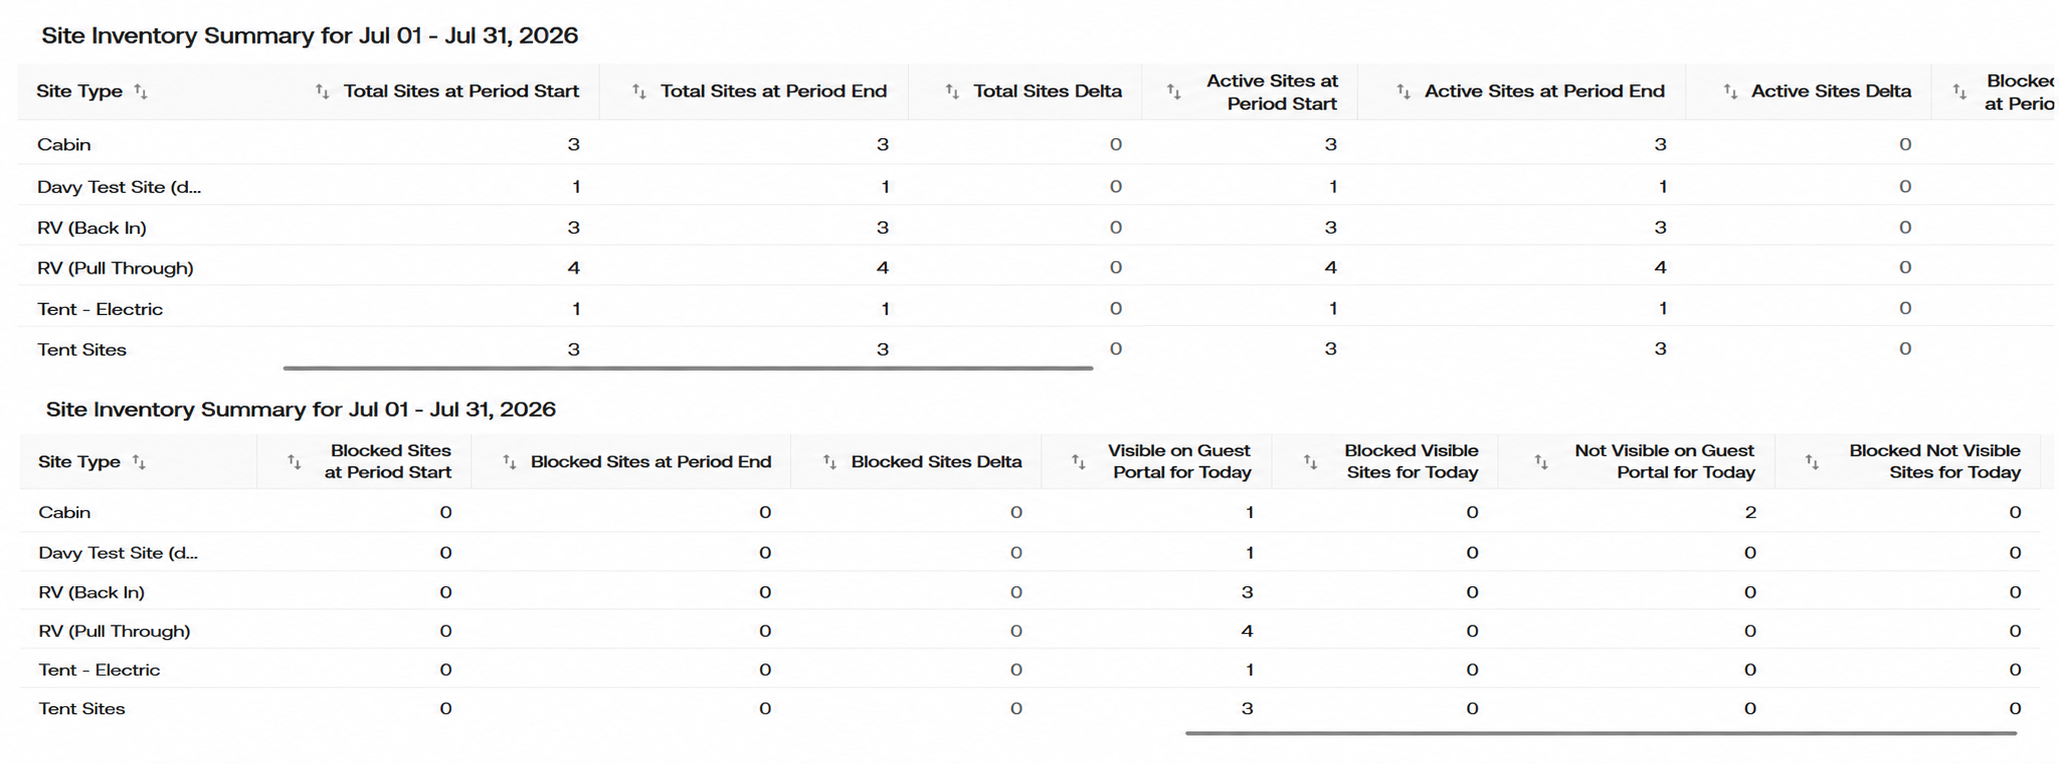
The Site Inventory Summary breaks down the campground’s inventory by site type. Each row represents one site type, such as Cabins, RV Back-In sites, RV Pull-Through sites, and Tent Sites.
Download the Report
Select the download icon in the upper-right corner to download a copy of the Inventory report.
Need More Help?
If you have questions about AI Reporting or would like help understanding your report results, please contact [email protected].