.png)
Understanding the AI Add-on Revenue Report
Our Add-on Revenue report shows you exactly how much revenue your campground earned from add-ons during the selected date range. It covers add-ons connected to reservations, plus items purchased separately through an order or point-of-sale transaction, so you get a complete picture.
This can include firewood, electric fees, propane, extra-adult charges, seasonal rentals, laundry, day-use passes, ice, and other store items.
The dates and the way the report is grouped are shown right under the report name. In this example, the report covers July 26 through September 5, 2026, with the information grouped weekly to make it easier to review trends over time.
Report Overview
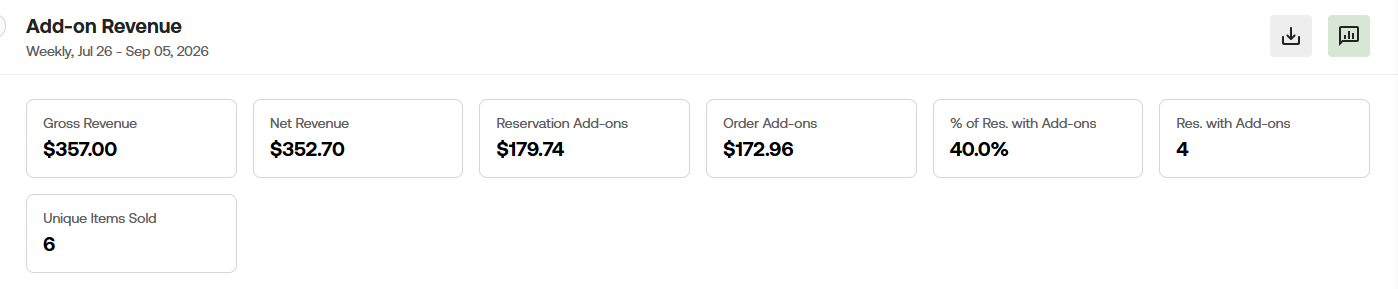
The dates and the way the report is grouped are shown right under the report name. In this example, the report covers July 26 through September 5, 2026, with the information grouped weekly to make it easier to review trends over time.
- Gross Revenue shows the full amount recorded from add-on sales before any reductions. In this example, the add-ons generated $357.00 in gross revenue.
- Net Revenue shows the adjusted add-on revenue total. Refunds reduce this amount. In this example, the net revenue is $352.70.
- Reservation Add-ons shows the net revenue from add-ons connected to reservations. In this example, reservation add-ons generated $179.74.
- Order Add-ons shows the net revenue from add-ons purchased separately through an order or point-of-sale transaction. In this example, order add-ons generated $172.96.
- Together, the Reservation Add-ons and Order Add-ons equal the $352.70 Net Revenue shown in the report.
- % of Res. with Add-ons is the attach rate. It shows the percentage of reservations that included at least one add-on. In this example, 40.0% of reservations included an add-on.
- Res. with Add-ons shows the number of reservations that included at least one add-on. In this example, 4 reservations included add-ons.
- Unique Items Sold shows how many different add-ons were sold. In this example, 6 different add-ons were sold.
Add-on Revenue Chart
The chart shows when add-on revenue was earned during the selected date range. Dates with no sales are still included, so you can clearly see slower periods.
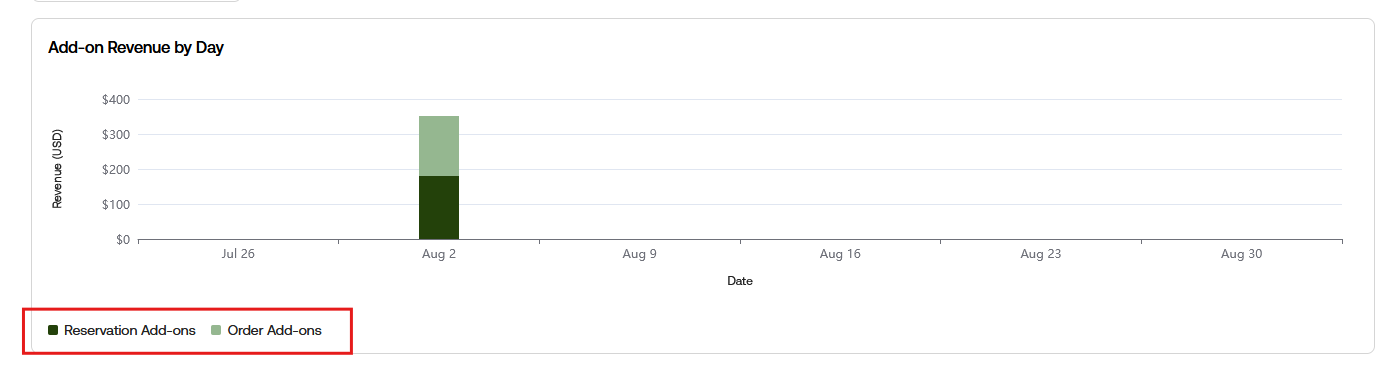
Dark green represents add-ons connected to reservations. Light green represents add-ons purchased separately through an order.
The colors are stacked in the same bar so you can compare both sources of revenue. In this example, the report shows $179.74 from reservation add-ons and $172.96 from order add-ons during the week of August 2.
The chart follows the grouping selected for the report. If you choose a longer date range, the chart may automatically group the results by month to keep it easier to read.
Add-on Breakdown
The table breaks the results down by each add-on. This allows you to see which items were sold, how much revenue each one generated, and how many units were purchased.
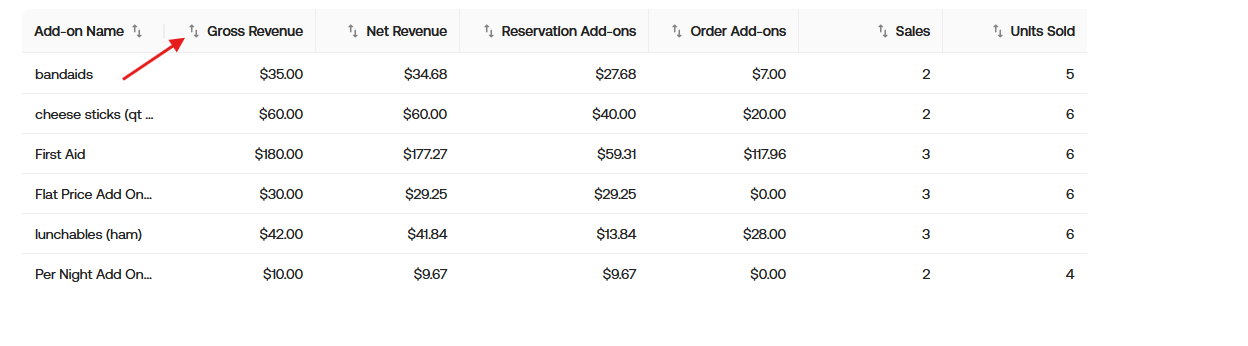
For example, band aids shows 2 sales and 5 units sold. This means band aids were included in two sales, but five total units were purchased.
- Add-on Name shows the name of the add-on.
- Gross Revenue shows the full amount recorded from sales of that add-on before any reductions.
- Net Revenue shows the adjusted revenue for that add-on. Refunds reduce this amount.
- Reservation Add-ons shows how much of the net revenue came from add-ons connected to reservations.
- Order Add-ons shows how much of the net revenue came from separate order or point-of-sale purchases.
- Sales shows how many sales included the add-on.
- Units Sold shows the total quantity sold. This number may be higher than the number of sales when someone purchases more than one of the same item.
The arrows beside the column names can be used to sort the table.
What to Know
- Units sold may be slightly lower than the actual number for older records because some older billing entries do not include complete quantity information. Revenue totals are still accurate.
- Units Sold is based on the original quantity purchased. It does not decrease when an item is refunded. Refunds are reflected in the revenue totals instead.
- The attach rate cannot display more than 100%. A known issue involving billing dates and check-in dates may affect this calculation.
- Add-ons cannot currently be grouped by category.
Download the Report
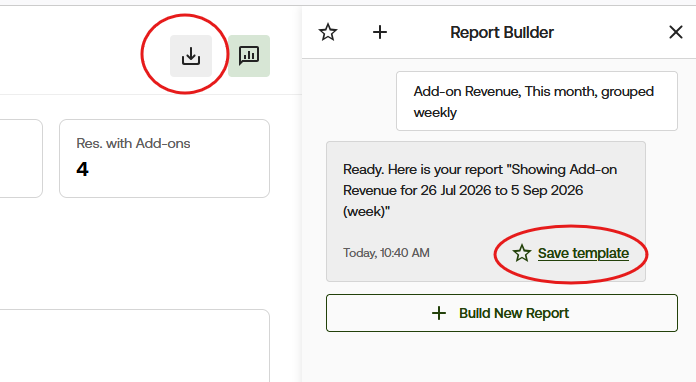
Select the download button in the upper-right corner to download the report results.
Select Save template in the Report Builder to save the report setup for later use. This saves the report type, date range, and grouping you selected so you can run the same type of report again.
Saving a template does not download the report results.
Need More Help?
If you have questions about the Add-on Revenue report or need help understanding the results, contact [email protected].