.png)
Understanding the AI Reservation Cancellation Report
The Reservation Cancellation report shows how many reservations were cancelled during the selected date range. It shows the number of cancelled nights, the revenue connected to those cancellations, and which site types had cancellations.
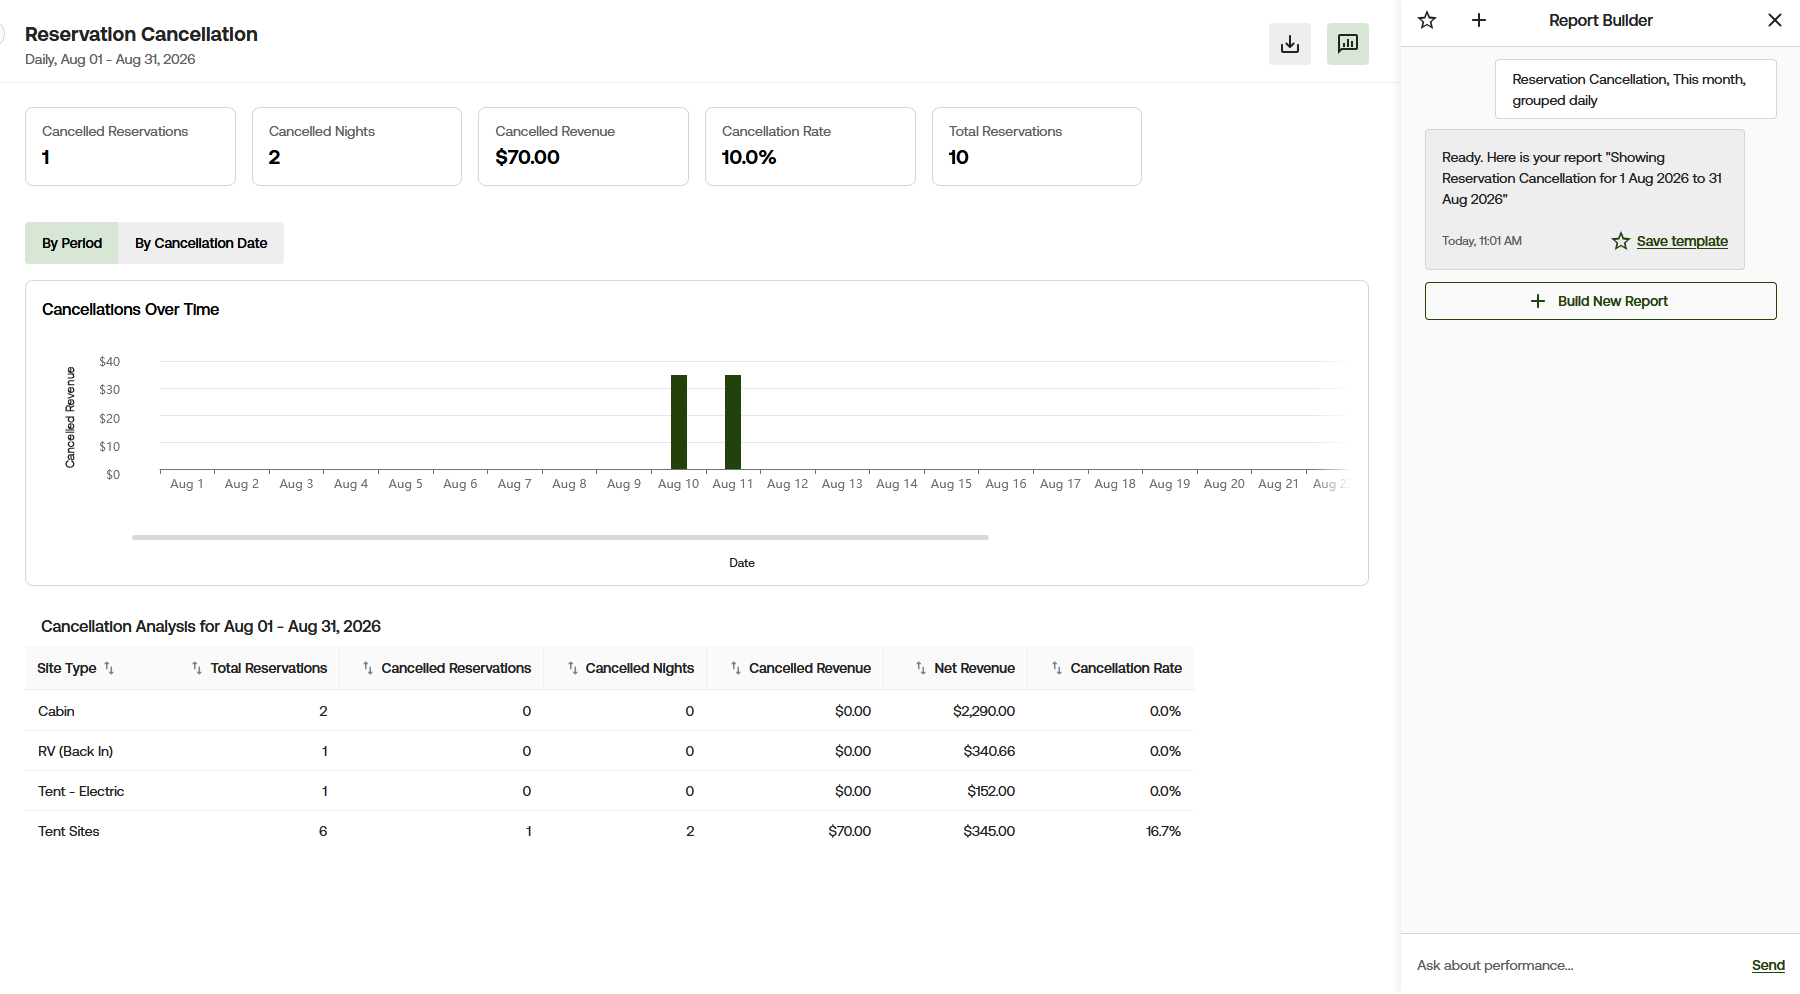
Report Overview
You can see the dates and how the report is grouped right under the report name, so it’s easy to get a feel for the coverage period and how the data is organized before you look at anything else. In this example, the report covers August 1 through August 31, 2026. The information is grouped daily, so you can see the results broken out by each day within that time range. That daily grouping helps you spot patterns over the month, compare day-to-day activity, and quickly notice any dates that stand out.

- Cancelled Reservations shows the number of reservations that were cancelled. In this example, 1 reservation was cancelled.
- Cancelled Nights shows the number of reserved nights included in those cancellations. In this example, 2 nights were cancelled.
- Cancelled Revenue shows the reservation revenue connected to the cancelled nights. In this example, the cancelled revenue is $70.00.
- Cancellation Rate shows the percentage of reservations that were cancelled. In this example, 1 of 10 reservations was cancelled, giving the campground a cancellation rate of 10.0%.
- Total Reservations shows the total number of reservations included in the report. In this example, there are 10 reservations.
Cancelled Revenue does not confirm that the same amount was refunded to the guest. The refund amount depends on the campground’s cancellation policy, the amount already collected, and any cancellation fee applied.
Viewing the Report
The chart shows when cancelled revenue falls within the selected date range. Each bar represents a date. A taller bar means more revenue was connected to cancellations on that date.
In this example, one two-night reservation was cancelled. The $70.00 in cancelled revenue is divided between August 10 and August 11 because those were the scheduled stay dates. Use the bar at the bottom of the chart to scroll through the remaining dates.
The report can be viewed in two ways:
- By Period shows the cancelled nights and revenue on the dates the cancelled reservation was scheduled to stay.
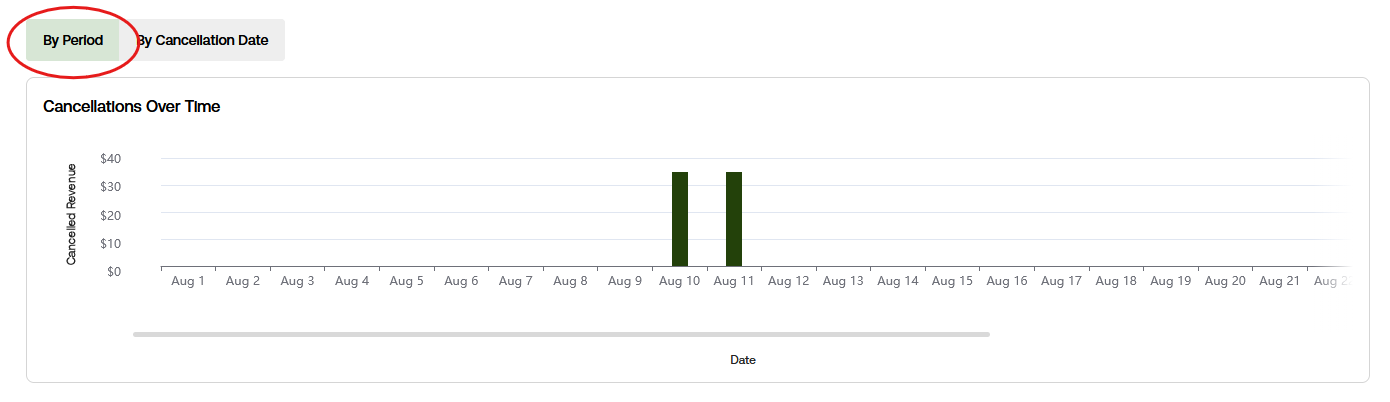
- By Cancellation Date groups the results by the date the reservation was cancelled.
This allows you to see when the lost stay was scheduled or when the cancellation was completed.

Cancellation Analysis
The table breaks the results down by site type. This allows you to compare cancellations across Cabins, RV sites, Tent Sites, and your other site types.
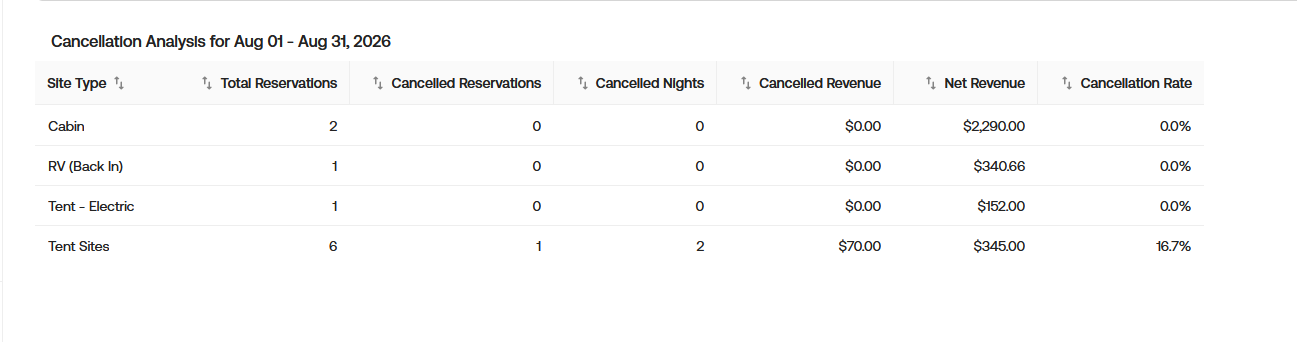
For example, Tent Sites had 6 total reservations. One reservation was cancelled, which included 2 nights and $70.00 in cancelled revenue. This gives Tent Sites a cancellation rate of 16.7%.
- Site Type shows the type of site included in the reservations.
- Total Reservations shows the total number of reservations for that site type.
- Cancelled Reservations shows how many reservations for that site type were cancelled.
- Cancelled Nights shows how many reserved nights were cancelled.
- Cancelled Revenue shows the reservation revenue connected to the cancelled nights.
- Net Revenue shows the net reservation revenue for that site type during the selected date range.
- Cancellation Rate shows the percentage of reservations for that site type that were cancelled.
The arrows beside the column names can be used to sort the table.
Download the Report
Select the download button in the upper-right corner to download the report results.

Select Save template in the Report Builder to save the report setup for later use. This saves the report type, date range, and grouping you selected so you can run the same type of report again.
Saving a template does not download the report results.
Need More Help?
If you have questions about the Reservation Cancellation report or need help understanding the results, contact [email protected].